Build and validate a strategy in one workspace.
Strategy Lab brings the complete strategy definition, historical test and platform export into one visual workspace. Configure the market assumptions, express the entry logic, define risk controls and inspect the result without writing code.
Design visually Build BUY and SELL entries from reusable price, indicator and logical condition blocks.
Test the full contract Include data, costs, risk, limits, trading windows and exit behavior in the historical test.
Continue to the broker Save the strategy and use the available platform export after reviewing its evidence.
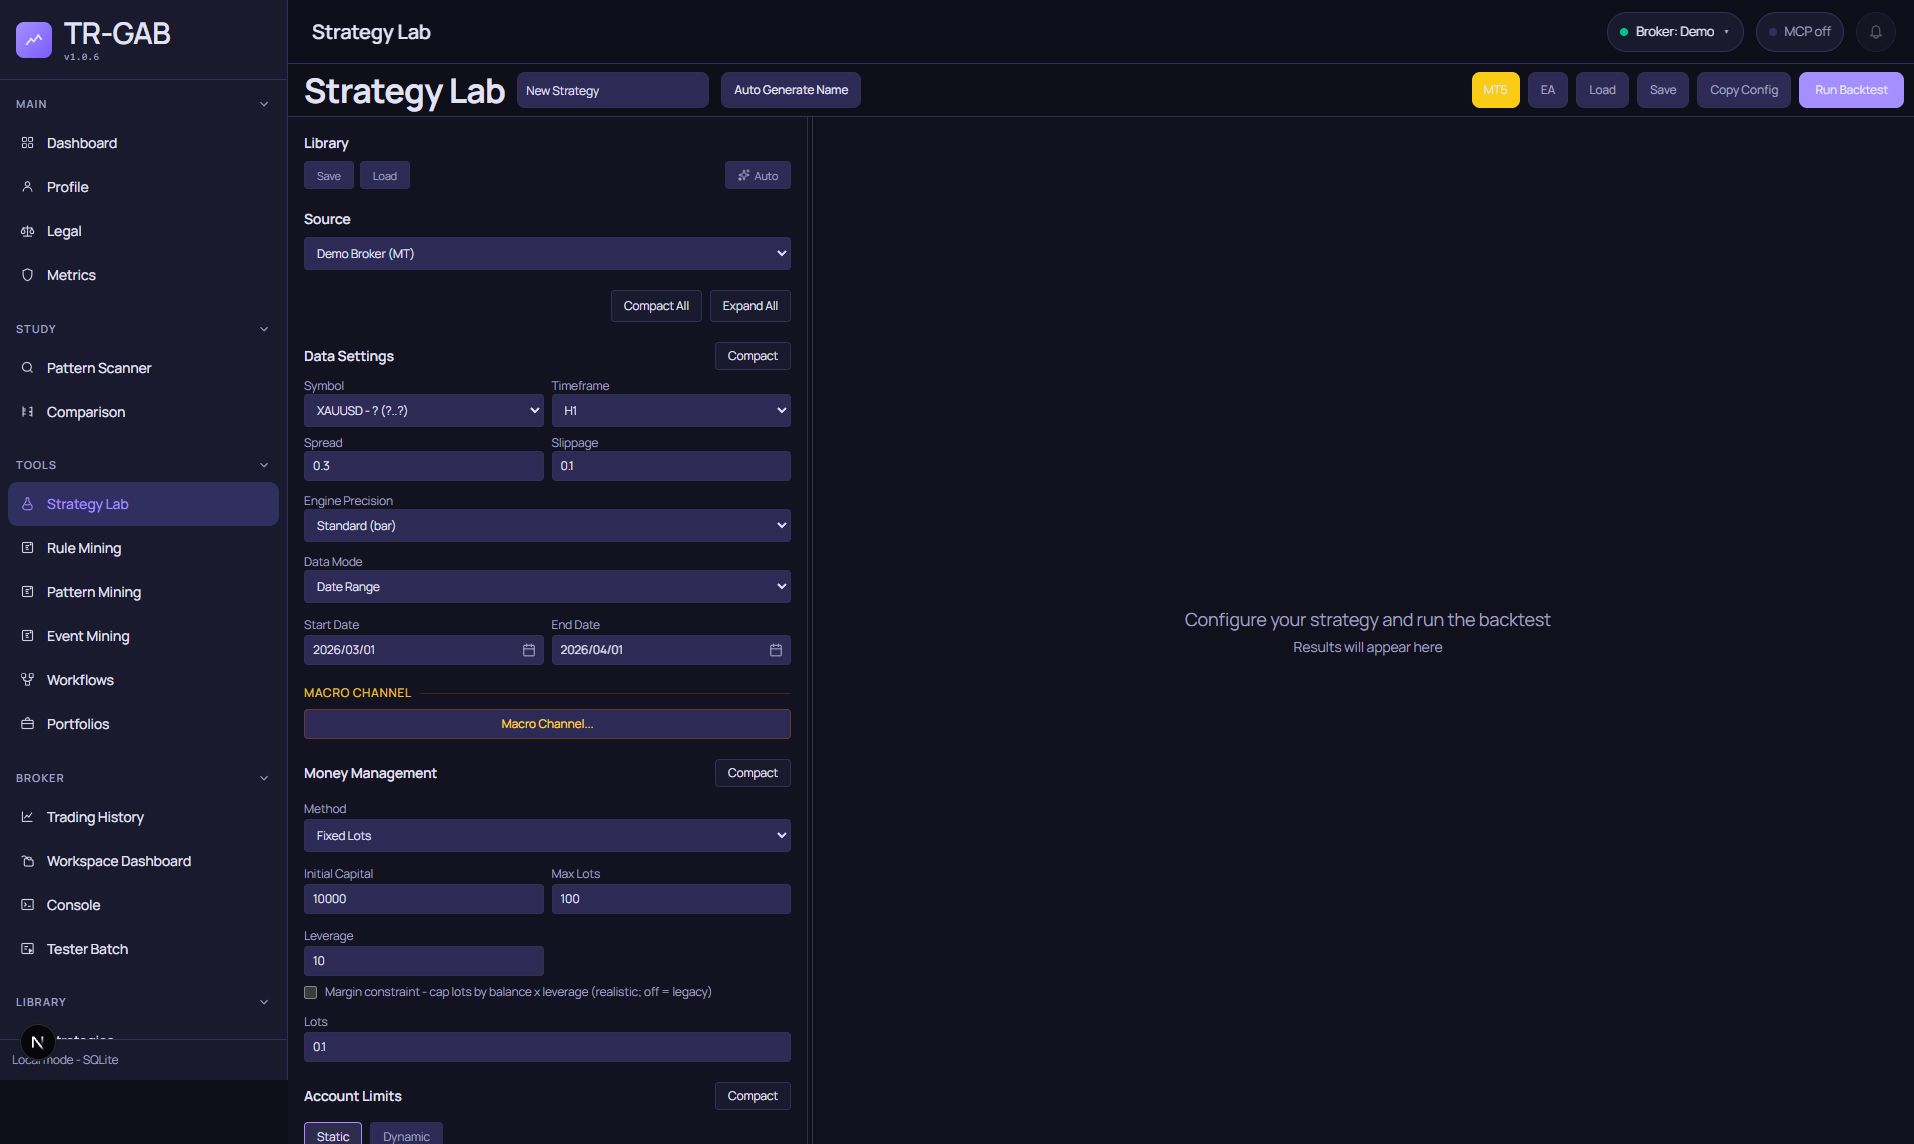
Strategy Lab captured automatically from the current development version with safe demo data and no backtest executed.
Define the test environment
Start by selecting the market-data source, symbol and timeframe. The data mode defines the historical window, while spread, slippage and engine precision describe how orders should be simulated. These settings are part of the strategy contract and are preserved with the definition.
Optional Macro Channel controls let you calculate and attach a higher-timeframe regime to the strategy. Use it to visualize the broader market context or to guard entries during the backtest.
Build the entry logic
BUY and SELL entries are composed from condition blocks. A condition can compare:
- Price with an indicator.
- An indicator with a numeric threshold.
- One indicator with another indicator.
- Crosses and other supported logical relationships over configured periods, shifts and timeframes.
Conditions can be enabled independently and combined inside an entry. Reusable condition banks help apply the same idea across Labs, miners and Workflows without rebuilding it by hand.
Configure execution and risk
The strategy editor keeps the controls that materially change a result next to the entry logic:
- Money-management method, initial capital, leverage and maximum lots.
- Static or dynamic account limits, daily pauses and trade limits.
- Stop-loss, take-profit, breakeven and trailing-stop behavior.
- Broker commission and swap assumptions when enabled.
- Trading windows, Friday exits and end-of-day exits.
These controls are evaluated as strategy behavior, not presentation-only metadata. Review them before comparing results or exporting to a target platform.
Run and inspect the backtest
Select Run Backtest when the strategy definition and data range are ready. Strategy Lab returns the KPI summary, equity curve, price chart and trade list for the internal engine. Individual trades can be inspected to understand why and when a position opened or closed.
Use the result as evidence, not as a promise. A useful next step is to retest on a different period or market, then apply robustness and walk-forward validation in a Workflow.
Read the equity in zones
View Macro paints the D1 candles of the backtest with the equity curve on top and coloured bands that say what the strategy was doing at each moment. The Zones selector picks how those bands are computed; every type is also explained by the i button next to it.
- Macro zones: the classic view. Red starts at an equity peak and lasts until a new high, but only when the stall is real: at least 5 sessions, 5 trades and a 2% dip. Everything else is green.
- Stagnation: every stretch without a new equity high, day by day. Red when it lasts at least min days (5 by default), green while the strategy is making new highs.
- Win / lose: whether the equity is rising or falling right now, regardless of the previous high. Green from a trough to the next peak, amber from a peak to the next trough, so a rebound is green before the old high is beaten. min move % sets how big a swing must be to count.
- Drawdown: how much is lost on each fall, red from a peak to its deepest trough with the depth in the tooltip. min depth % hides the shallow ones.
- All: every type overlaid with a light tint, to compare them on the same candles.
Hover a band for its label, dates, duration and the trades closed inside it. The thresholds are remembered per browser and do not change the strategy or its saved KPIs.
The same zones through MCP
Agents get exactly what the selector paints with the tool get_strategy_zones: pass a
strategyId from the Library (or an equity array with its trades), optionally
types (macro, stagnation, trend, drawdown_peak_to_trough) and options
(stagnationMinDays, trendMinMovePct, drawdownMinDepth). The answer lists, per type,
each zone with its kind, dates, duration, trades and depth, plus the counts. The badPeriods
that travel with get_strategy are the older stagnation list with a 1-day threshold; use
get_strategy_zones when you need the thresholded view.
Save, reuse and export
The Library can save and load the full Strategy Lab configuration. Copy Config makes the current setup available to compatible product surfaces, while automatic naming creates a consistent name from the configured strategy.
Platform actions are separate from the internal backtest. They generate the native artifact for the selected target and use the configured broker connection and destination. Always review the target-platform test before deploying an exported strategy.
A practical first strategy
- Select the source, symbol, timeframe and historical window.
- Set realistic spread, slippage, commission and swap assumptions.
- Add one focused BUY or SELL entry and define its exits.
- Configure money management, account limits and the trading window.
- Run the internal backtest and inspect KPIs, trades and the equity curve.
- Retest and validate the candidate in a Workflow.
- Export only after the target-platform result is understood.
Keep the first test explainable. A small strategy definition with realistic costs is easier to diagnose, compare and improve than a large rule set optimized around one historical result.